
+1 (905)-301-9983
The Cape Spencer Project
The Cape Spencer Project is an exploration stage project that has a history of past-production and the potential for near-term resource growth and discovery. The Project comprises 8 mineral claims (224 units) covering more than 5,045 hectares and is located 15 kilometres east of the City of Saint John, New Brunswick. Recent exploration success in southern New Brunswick at Galway Metals Clarence Stream Project continues to support the potential of this region to host gold deposits of significant size. The Clarence Stream Deposit is host to combined open-pit and underground Indicated Mineral Resources of 922,000 ounces of gold (12,396,000 tonnes at 2.31 g/t gold) and Inferred Mineral Resources of 1,334,000 ounces of gold (15,963,000 tonnes at 2.60 g/t gold).
Project Highlights
- 5,045 hectares along 15 kilometres of strike of a regional-scale gold bearing structure - the Millican Lake Fault and associated structures;
- Newly expanded Project is host to large untested gold bearing alteration systems including:
- 2.5-kilometre alteration and gold bearing Emilio Trend with drill intercepts up to 7.86 g/t gold over 7.4 metres;
- Marigold Prospect with drill intercepts up to 8.71 g/t gold over 2 metres (core length; true width unknown);
- Birches Zone with drill intercepts up to 5.23 g/t gold over 4.0 metres (core length; true width unknown);
- The Cape Spencer Deposit has an Inferred Mineral Resource Estimate of 1,720,000 tonnes at an average grade of 2.72 g/t gold for 151,000 contained ounces in two zones:
- Northeast Zone - Inferred Mineral Resource of 740,000 tonnes at an average grade of 4.07 g/t gold, for 96,000
- Pit Zone - Inferred Mineral Resource of 990,000 tonnes at an average grade of 1.71 g/t gold, for 54,000 contained ounces at a cut-off grade of 0.5 g/t gold in a conceptual open pit.
- Hosted within similar Proterozoic-aged rocks of the Avalon Zone that host multi-million ounce gold deposits such as Haile, Ridgeway and Hope Brook; and
- Two gold deposits open along strike (Northeast and Pit Zones).
Cape Spencer Deposit Mineral Resource Estimate
The Inferred Mineral Resource Estimate for the Cape Spencer Deposit is 1,720,000 tonnes at an average grade of 2.72 g/t gold for 151,000 contained ounces at cut-off grade of 0.5 g/t gold and 2.5 g/t gold in two mineralized zones, the *Pit Zone and the Northeast Zone, with an effective date of January 23, 2019 (Table 1). The Northeast Zone contains a conceptual underground Inferred Mineral Resource Estimate of 740,000 tonnes at an average grade of 4.07 g/t gold for 96,000 contained ounces at a cut-off grade of 2.5 g/t gold and the *Pit Zone contains a conceptual open-pit Inferred Mineral Resource Estimate of 990,000 tonnes at an average grade of 1.71 g/t gold for 54,000 contained ounces at a cut-off grade of 0.5 g/t gold.
Table 1: Cape Spencer Project Mineral Resource Estimate – Effective Date: January 23, 2019
| Area | Cut-Off (Au g/t) | Category | Rounded Tonnes | Au (g/t) | Rounded Ounces |
|---|---|---|---|---|---|
| Northeast Zone | 2.5 | Inferred | 740,000 | 4.07 | 96,000 |
| *Pit Zone | 0.5 | Inferred | 990,000 | 1.71 | 54,000 |
| Total | 0.5 and 2.5 | Inferred | 1,720,000 | 2.72 | 151,000 |
- This Mineral Resources Estimate was prepared in accordance with NI 43-101 and the CIM Standards (2014)
- Mineral Resource tonnages have been rounded to the nearest 10,000 and ounces have been rounded to the nearest 1,000. Totals may not sum due to rounding.
- A cut-off of 2.50 g/t gold was used to estimate Mineral Resources for the Northeast Zone.
- A cut-off of 0.50 g/t gold was used to estimate Mineral Resources for the Pit Zone.
- Mineral Resources were interpolated using Ordinary Kriging from 1.5m assay composites capped at 15 g/t gold.
- An average bulk density of 2.74 g/cm3 has been applied.
- Northeast Zone Mineral Resources extend to a maximum depth of 225m below surface and are considered to reflect reasonable prospects for economic extraction in the foreseeable future using conventional underground mining methods at a gold price of CAD $1,550 per ounce.
- Pit Zone Mineral Resources extend to a maximum depth of 100m below surface and are considered to reflect reasonable prospects for economic extraction in the foreseeable future using conventional open-pit mining methods at a gold price of CAD $1,550 per ounce.
- Mineral Resources do not have demonstrated economic viability.
- This estimate of Mineral Resources may be materially affected by environmental, permitting, legal title, taxation, sociopolitical, marketing, or other relevant issues.
**The term “Pit Zone” reflects previously established deposit nomenclature that has been retained by Magna Terra. It does not denote application of an optimized pit shell or envelope for definition of Mineral Resources presented in Table 3 above.
Geology and Mineralization
The Cape Spencer Project is centered along the gold bearing Millican Lake Fault, a regional splay of the Caledonia and Cobequid Fault zones. The Property is underlain by Precambrian Millican Lake granite, and Broad River and Cape Spencer volcanic and sedimentary rocks. The Precambrian stratigraphy is unconformably overlain by and in fault contact with younger Carboniferous sedimentary rocks of the Lancaster Formation.
Gold mineralization at Cape Spencer is hosted within Precambrian Millican Lake granite or bounding Broad River Group and Cape Spencer volcanic and sedimentary rocks, with mineralization and alteration focused along strongly faulted and sheared contacts between the two lithologies. Alteration consists of pervasive and patchy illite + pyrite + quartz ± iron carbonate ± sulfide veins and stockworks with 2-5% total sulfides consisting of pyrite, galena, chalcopyrite or sphalerite, and locally show trace amounts of visible gold.
There are several gold prospects that warrant additional exploration over a 15 kilometre strike outside of the Pit and Northeast Zones particularly in the eastern half of the property that will initially be a primary focus for Magna Terra.
Highlights from historic exploration work (all drill and channel intercepts reported as core length; true width unknown) outside of the main deposit areas from 1982 to 2004 include:
Cape Spencer Mine (Pit Zone)
Past-Producing (1985-1986) Mine. Highlight assays include:
- 13.89 g/t gold over 2.46 metres within a zone grading 4.76 g/t gold over 9.45 metres (GX-86-09);
- 6.22 g/t gold over 1.52 metres within a zone grading 2.13 g/t gold over 21.0 metres (GX-82-18);
- 27.08 g/t gold over 1.08 metres within a zone grading 5.10 g/t gold over 9.15 metres (GX-86-29); and
18.00 g/t gold over 1.50 metres within a zone grading 5.18 g/t gold over 8.25 metres (AB-04-10).
Northeast Zone
Located 400 metres northeast of the Cape Spencer Mine. Interpreted to be continuous with the Road Zone. Highlight assays include:
- 41.96 g/t gold over 2.45 metres within a zone grading 7.72 g/t gold over 16.2 metres (CS-87-06);
- 16.20 g/t gold over 1.5 metres within a zone grading 4.45 g/t gold over 19.0 metres (CS-87-08);
- 11.52 g/t gold over 3.0 metres within a zone grading 4.85 g/t gold over 10.5 metres (CS-87-13); and
- 12.54 g/t gold over 4.0 metres within a zone grading 4.26 g/t gold over 18.5 metres (CS-87-17).
Road Zone
400-metre-long zone of gold-bearing alteration zone with an average width of 20 metres. This zone is interpreted to be the along strike continuation of the Northeast Zone. Highlight assays include:
- 16.28 g/t gold over 2.5 metres within a zone grading 1.81 g/t gold over 55.0 metres (MR-087);
- 10.35 g/t gold over 1.0 metres within a zone grading 1.49 g/t gold over 20.7 metres (MR-147); and
- 13.06 g/t gold over 2.0 metres within a zone grading 1.28 g/t gold over 18.0 metres (MR-105).
Emilio Trend
Includes the Emilio Prospect at Eastern end of Property
- 7.86 g/t gold over 7.4 metres (AB-04-06; near surface);
- 12.00 g/t gold over 1.4 metres (chip) and 2.77 g/t gold over 3.0 metres (chip);
- Surface grab samples up to 168.00 g/t gold*;
- Zone A – Grab samples up to 53.50 g/t gold*;
- Zone C – Grab samples up to 8.92 g/t gold* and chip sample of 2.77 g/t gold over 3.0 metres; and
- Zone D – Five occurrences of visible gold with grab samples up to 7.12 g/t gold*.
Birches Zone
300-metre-long gold-bearing alteration zone south of the Northeast Zone.
- 17.85 g/t gold over 1.0 metre within a zone grading 5.23 g/t gold over 4.0 metres (MR-150);
- 9.48 g/t gold over 1.0 metre within a zone grading 4.01 g/t gold over 4.0 metres (MR-149); and
- 3.60 g/t gold over 5.0 metres (AB-04-08).
Marigold Prospect
- Historic drill assays of 8.71 g/t gold over 2.0 metres (drillhole MGB-88-2); and
- Historic grab samples up to 4.41 g/t gold**
Note: Analytical results are sourced in the Cape Spencer Project Technical Report (2019) – see “Technical Reports and Documentation Notes” below; “grab samples” are selected samples and are not necessarily indicative of mineralization that may be hosted on the property.
*Note: “grab and boulder samples” are selected samples and are not necessarily indicative of mineralization that may be hosted on the property.
Mineral Claims and Option Agreements
The Cape Spencer Project is subject to three separate option agreements on the Cape Spencer, Armstrong, and Marigold Properties, as detailed below, whereby the Company can earn a 100% interest in the mineral rights.
The Cape Spencer Property includes a total of 104 mineral claim units covering 2,365 hectares of land acquired via either staking and or under terms of the Cape Spencer Option Agreement. Under the Cape Spencer Option Agreement, the Company can earn a 100% interest in the property by paying a total of $350,000 in cash (of which $225,000 has been paid) and $145,000 in milestone payments based on certain exploration activities (of which $50,000 has been paid) in cash or equivalent value shares over a seven-year period ending August 9, 2025. The Company has also satisfied its commitment under the agreement to complete $400,000 in exploration expenditures within the first four years. A 2% NSR is payable with one percent of the NSR purchasable for $1,000,000 and a right of first refusal on the remaining 1% NSR.
On August 15, 2020, the Company acquired the option to earn a 100% interest in the Marigold Property, which consists of 4 mineral claims (88 units, 1,998 hectares) by paying a total of $95,000 in cash (of which $35,000 has been paid) and issuing $105,000 in cash or equivalent-value common shares over a 4-year period (of which $45,000 has been paid). The Property is subject to a 2% NSR with 1% purchasable by the Company for $1,500,000 and right of first refusal on the remaining 1% NSR.
On August 15, 2020, the Company acquired the option to earn a 100% interest in the Armstrong Property, which consists of 1 mineral claim (30 units, 682 hectares) by paying a total of $45,000 (of which $25,000 has been paid) and issuing $45,000 in cash or equivalent value common shares over a 3-year period (of which $25,000 has been paid). The Property is subject to a 2% Gross Metal Royalty (“GMR”) with 1% purchasable for $1,000,000 and right of first refusal on the remaining 1%.
Technical Reports and Documentation Notes
NI 43-101 Technical Report
The technical content of this website has been reviewed and approved by David A. Copeland, P.Geo., Chief Geologist with Magna Terra Minerals Inc., a "Qualified Person", under National Instrument 43-101 - Standard for Disclosure for Mineral Projects.
Mineral Resources are not Mineral Reserves and do not have demonstrated economic viability. All Mineral Resource Estimates were prepared in accordance with NI 43-101 and the CIM Standards (2014).
The Mineral Resource Estimate quoted in this MD&A regarding the Cape Spencer Project refers to the technical report: “NI 43-101 Technical Report and Mineral Resource Estimate on The Cape Spencer Gold Deposit, Saint John County, New Brunswick, Canada”, (the “Cape Spencer Report”) with an effective date of January 23, 2019, and authored by Michael Cullen, P.Geo. (Independent Qualified Person), and Matthew Harrington, P.Geo. (Independent Qualified Person).
Rock and core sample lengths from historic exploration programs that are reported are presented as core or sample lengths only. True widths of mineralized intervals are not known. All quoted drill core sample intervals, grades and production statistics were compiled from historic assessment reports obtained from the government of New Brunswick that are referenced in the Technical Report noted above.
Maps and Figures
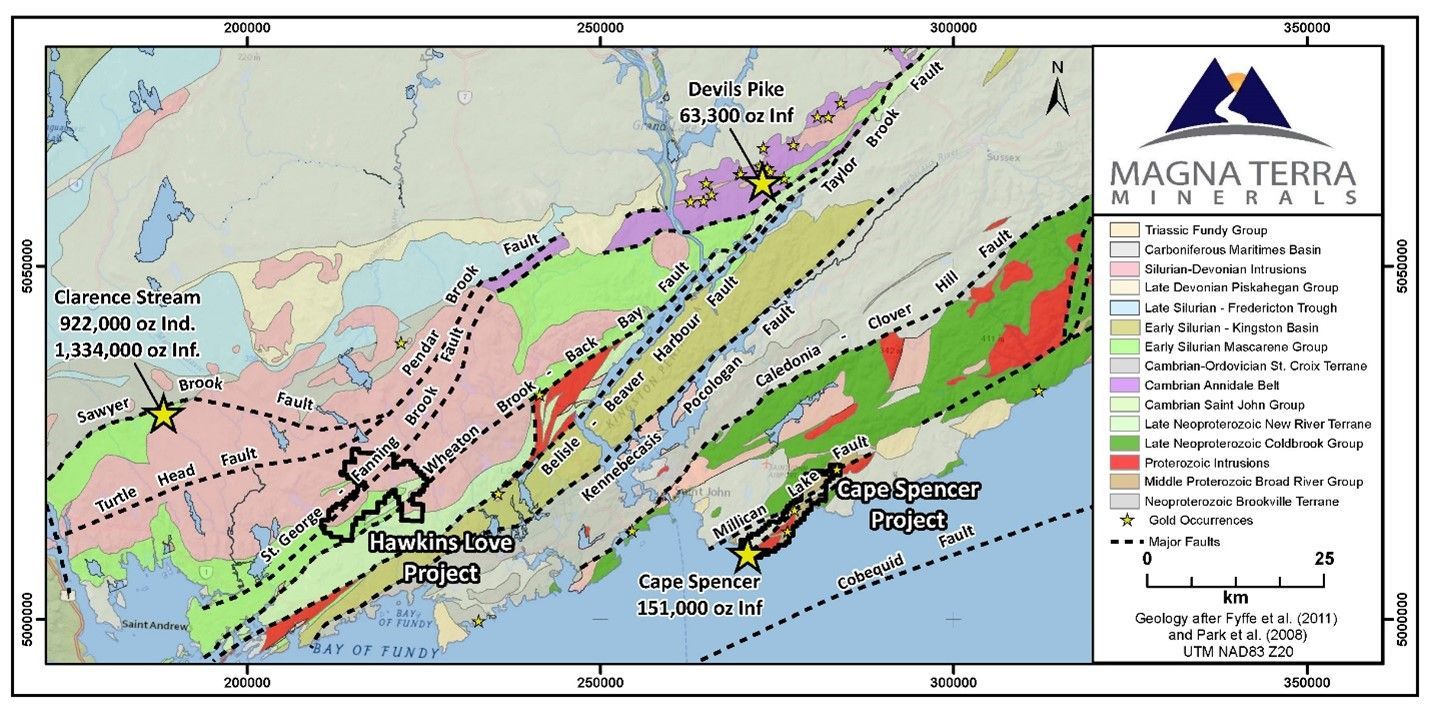
Figure 1: Regional Geology of Southern New Brunswick and location of the Cape Spencer Project.
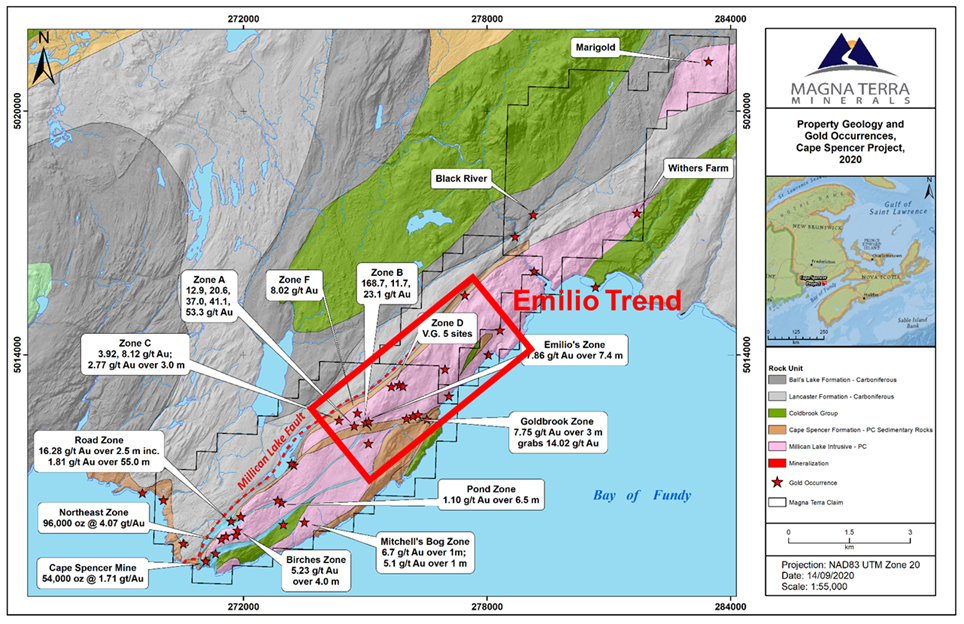
Figure 2: Cape Spencer Property geology and gold occurrences.
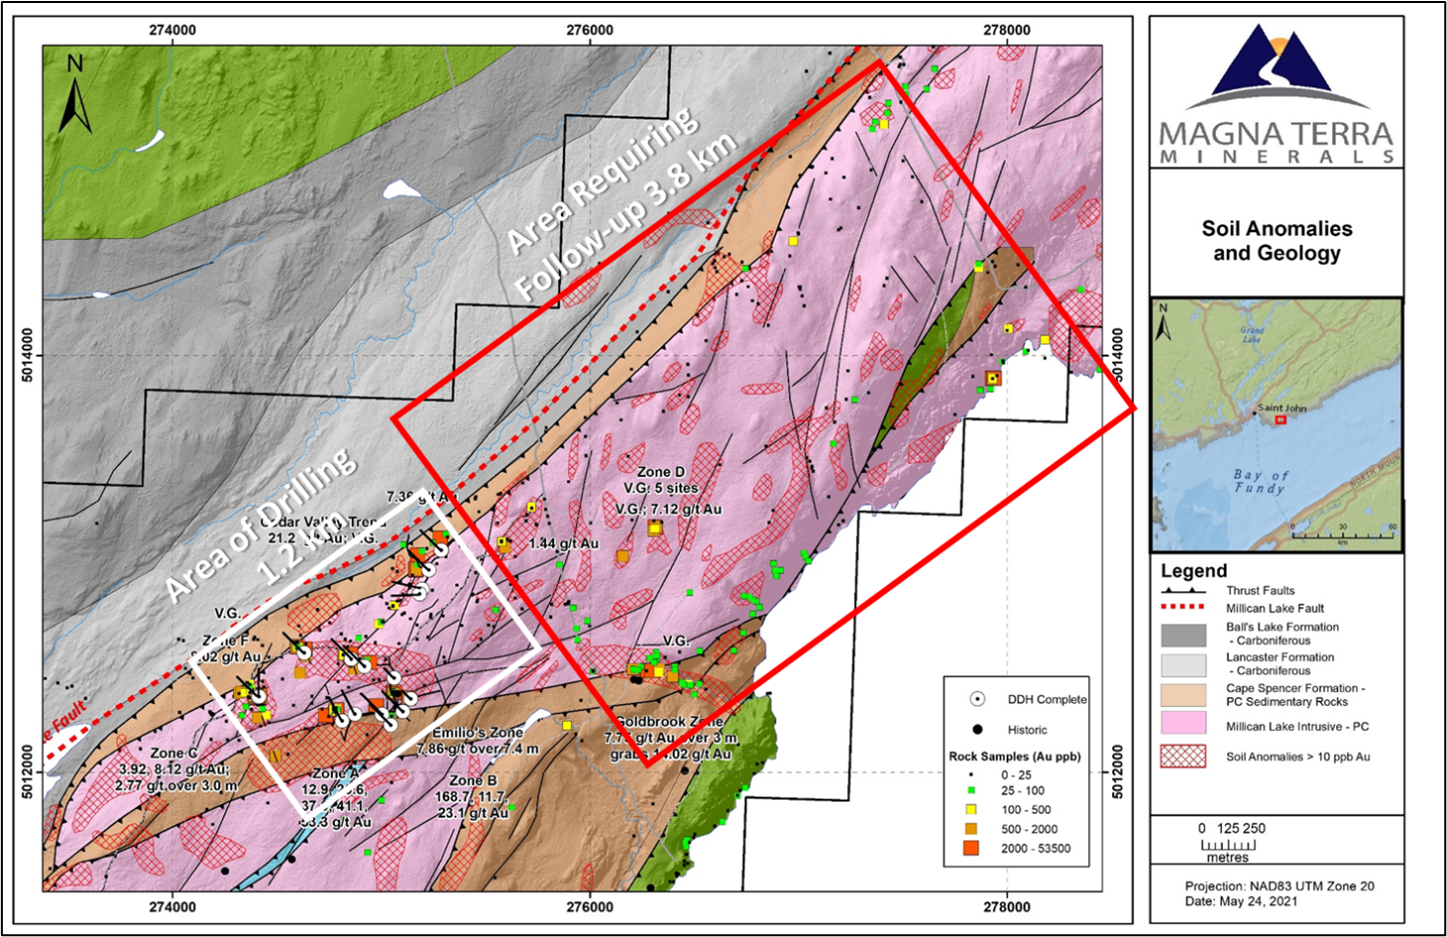
Figure 3: Geology, gold occurrences and drill holes of the Emilio Trend.
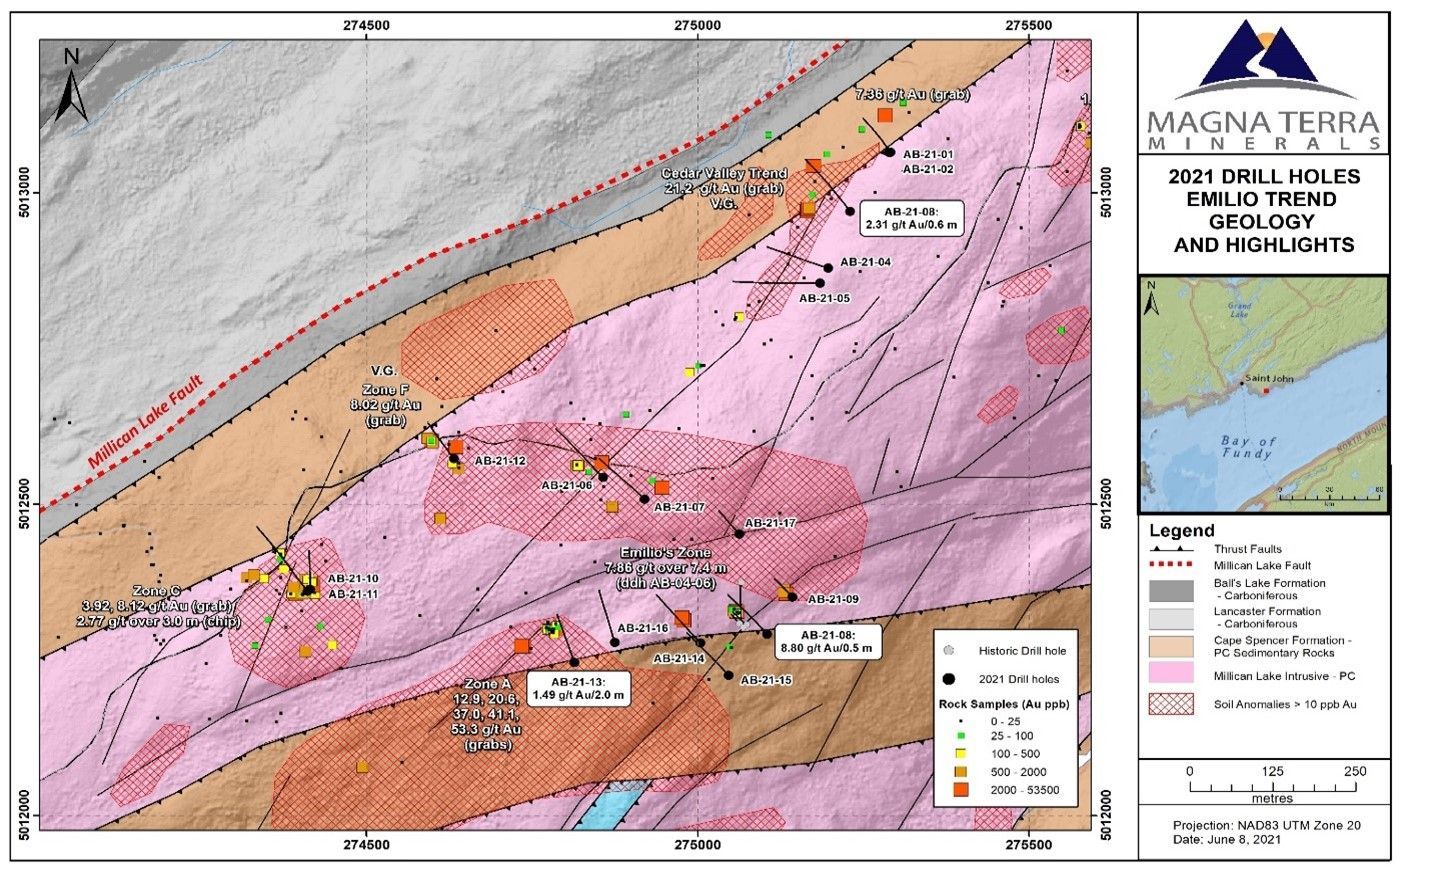
Figure 4: Geology and drill plan map of the Emilio Trend, including the Cedar Valley Trend.
